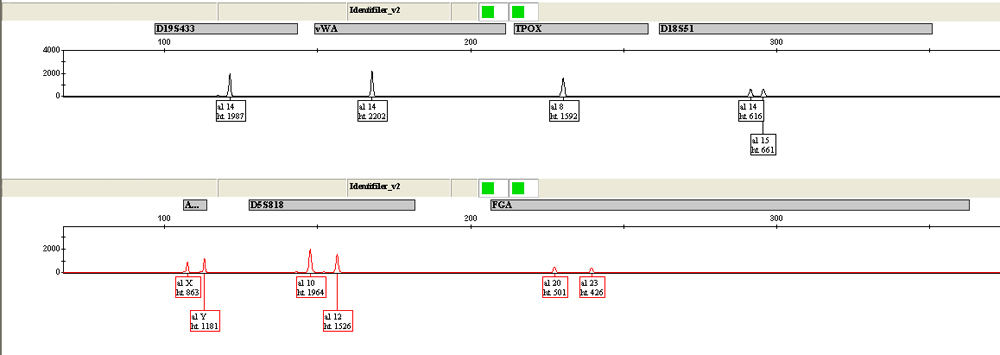
Once raw data (in the form of the previously seen electropherogram) has been saved into a computer, it may be analyzed using a software program. The software program will resolve the colors for each of the peaks seen in the raw data and size the piece of DNA associated with that color. Afterwards, the software will determine the genotype of the sample by comparing it to a standard that was run in the same batch. Individual allele calls are then made for each chromosomal location and an analyst checks the results. The below image is an example of what is seen by the analyst (for only two color channels). The analyst then compiles all of the data into what is called a "genetic profile."

The analyst then has the task of comparing the genetic profiles of crime scene evidence and a sample obtained from a suspect. There are three conclusions that an analyst can come to when comparing genetic profiles - an exclusion, inconclusive or inclusion. If the two samples do not match, then it is possible to conclude that the suspect did not contribute to the crime scene sample. If a crime scene sample and a suspect sample match, then an analyst must determine if the crime scene sample is from the same donor as the suspect sample, or if its possible that might by chance match the evidence in question. Analysts use population databases to determine the possibility of a random, unrelated member of the population who might match the suspect sample. This probability of randomly finding someone else in the population who matches a profile is called "random match probability." If a suspect's DNA profile occurs more often in a population, then it is less likely that the suspect donated the evidence sample - whereas, if a profile is more rare in a population, it is more likely that the suspect was the contributor of the questioned DNA sample.
|

